What it does
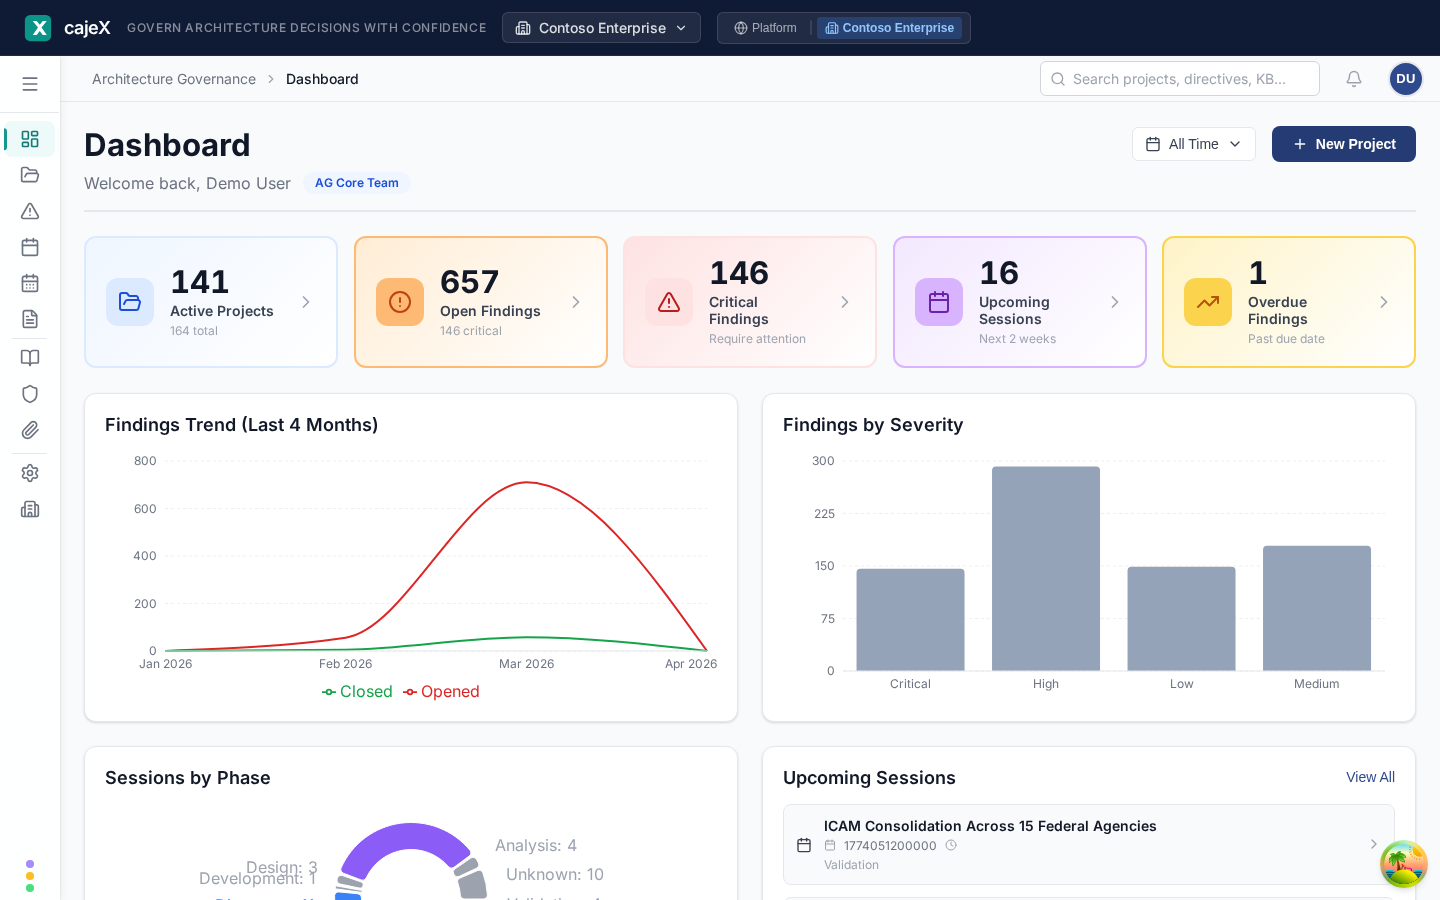
The Dashboard is your workspace's governance scorecard at a glance: counts of what is active and what is overdue, how findings are trending, how your directives are holding up, and what is on the calendar. It is the first thing your leadership will look at, and the first thing to check when you log in.
How to use it
The five tiles
Across the top:
- Active Projects, with the total number of projects beneath it.
- Open Findings, with how many of them are critical.
- Critical Findings that need attention.
- Upcoming Sessions in the next two weeks.
- Overdue Findings, past their due date.
Click a tile to open the list behind it, already filtered: the Overdue Findings tile opens Findings showing only overdue ones.
The date range
The picker at the top right sets the period the charts cover: Last 7 Days, Last 30 Days, Last 90 Days, Year to Date, All Time, or a Custom Range. It starts on All Time. Charts that follow the range say so in their title.
The charts
- Findings Trend — findings opened and closed per month. With no range chosen it shows the last four months.
- Findings by Severity — how the findings divide across critical, high, medium and low.
- Directive Conformance — how your approved directives divide across conformant, partially conformant, non-conformant, insufficient evidence, and not yet evaluated. A directive's status comes from the findings raised against it and the latest AI reviews.
- Top Directives by Open Findings — the directives collecting the most open findings, each with its current conformance. A directive that appears here across several projects is usually a sign the rule is unclear or hard to follow, not that several teams were careless.
- Sessions by Phase — where in the project lifecycle your review sessions are happening.
- Upcoming Sessions — the next sessions on the calendar. Click one to open it, or View All for the Calendar.
- Session Utilization — how much of your available review capacity is booked. If it stays high, ask your workspace admin about adding slots in the Calendar.
- Findings Aging Distribution — how long open findings have been open, in bands from a week to more than sixty days.
- Projects by Phase — how many projects sit in each phase.
New Project, top right, starts a project without leaving the Dashboard.
Permissions
Visible to everyone in the workspace. The numbers cover your workspace only.
Tips
- If a chart says there is no data, check the date range before anything else. A short range on a quiet week is often the answer.
- The Dashboard summarises; it does not generate. Empty tiles mean there are no projects or findings yet.
- Start a weekly review from Top Directives by Open Findings. It tells you which rule to talk about, where the findings list only tells you which project.